Go back to main menu.
The following graphs have been drawn thanks to this
results file. These results are
obtained after the program execution of one architecture.
DESCRIPTION OF THE GRAPHS
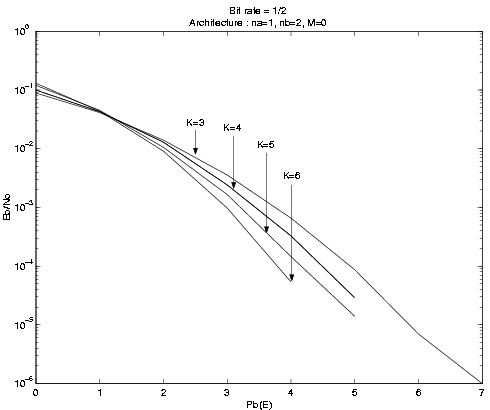
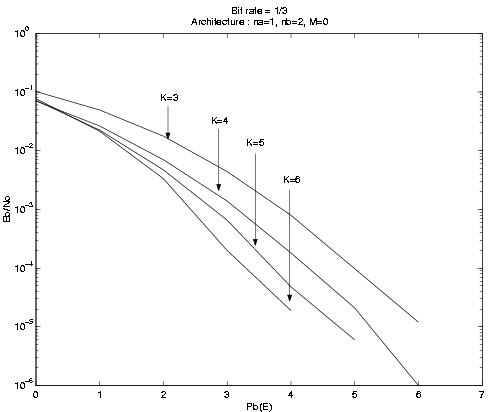
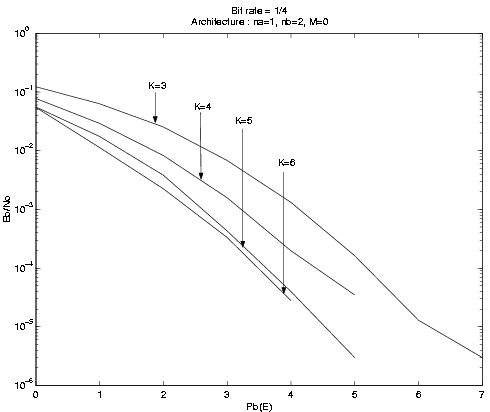
In the following figures, the horizontal axis represents the SNR(Signal Noise
Ratio) and the vertical axis represents the BER(Binary Error Rate). There are
three graphs because I simulate three different bit rate: 1/2, 1/3, 1/4. On each bit
rate representation, we can see different graphs. Each one has a different
constraint lenght, called K.